Structure and interpretation of AWS service health dashboard messages
Dissection time!
For the past three months I’ve been busy and haven’t had much of a time to write new blog posts. If you’re expecting more EC2 spot instance analysis you have to wait some more, sorry. Instead I want to share some results from one of the things I’ve been up to for the last three or so months.
I’ve been analyzing AWS service health dashboard messages — a whole lot of them. Have you ever been to the AWS dashboard? In short it is a place where AWS publishes information about events that affect their services. This data is accessible via the web page itself, but also as multiple RSS feeds (there’s also JSON data, but it is internal API, subject to changes and doesn’t have as good incident history record as RSS versions).
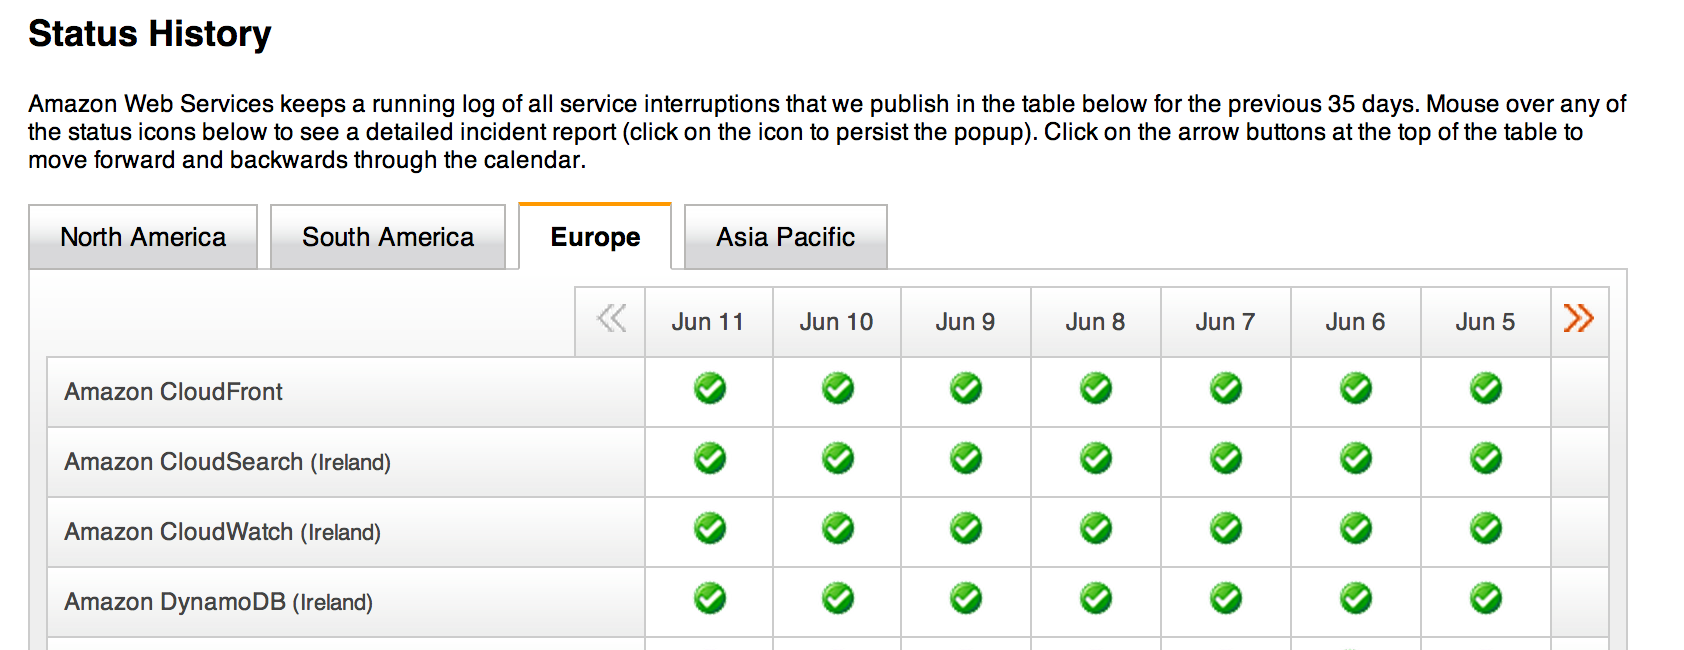
This is what the AWS service health dashboard’s history section looks like. Most of the time it’s very boring reading, all green checkmarks.
TL;DR
It is interesting to look at what AWS publishes in the service dashboard. For ADHD and TL;DR and PPRT readers out there findings first:
-
There’s no knowledge of what AWS actually publishes in the dashboard. Are all outages reported?
-
Incident descriptions are written by humans and meant to be read by humans.
In this post I won’t go into any kind of analysis of outage events, instead I’ll just focus on what common patterns and features these AWS service health dashboard messages share. I’ll get to outage analysis later (I think).
The longer version
First of all, I haven’t found any definition about when an incident warrants publishing a message in the dashboard. It seems to be along the line of “large scale”, “affecting multiple customers” or “externally visible” but that is solely based on observation and not on any statement from AWS.
Simple transient single-point failures are not reported — a server failure is not covered neither are any other failures that are transparently handled by a high availability mechanism (making them mostly invisible to the customer). As an example a failure of an ELB host or a networking component with failover capability may appear as momentary connection terminations or decreased performance, but these are hard to detect over the background level of “normal” failures from gazillion other causes.
It might be that AWS dutifully publishes every incident they or their customers detect. Alternatively they might only publish incidents AWS thinks are actually public. There might be a threshold of “N or more customers” where a large failure could go unreported if it affects less than N customers. There might actually be no policy and it is entirely up to the current operations staff to decide whether to report or not (which might lead to biases between regions, too).
So there’s already a large possibility of both systematic and random errors there.
To summarize previous point: you don’t have any idea how complete the information in the dashboard actually is.
AWS doesn’t publish much information on how they run their datacenters, but from compliance information it is possible to infer that to meet SOC 1/2/3 and ISO 27001 requirements they must have mechanisms that track, record and assess incidents in more detail than is shown in the dashboard itself. Whether their incident management processes are based on ITIL or something else isn’t known, but for the purpose of this post it isn’t really relevant.
Secondly, let’s take a look at what actually is published. The published information consists of:
- An identifier (as RSS GUID, based on service, region and publish time)
- Region and service
- Title
- Message body
That’s it. Compared to Azure dashboard’s
underlying JSON,
for example, the data you get from AWS dashboard is very
unstructured. It is essentially a pair of freetext fields. The title
and body content also varies quite a lot. I’ll show a few sample
messages. The first one is for Cloudwatch in the eu-west-1 region
published on February 19th 8:15 AM PST (first line is title, rest is
message body):
Service is operating normally: [RESOLVED] Delayed metrics in EU-WEST-1
Between 07:20 AM PST and 08:05 AM PST, customers may have experienced some delayed alarms in the EU-WEST-1 Region. We have resolved the issue. The service is operating normally.
and this one for RDS in the us-west-1 region from May 26th:
Informational message: Network Connectivity
We are continuing to bring the few remaining impacted instances back online in a single Availability Zone in the US-WEST-1 Region.
Going through a lot more of these messages you’ll notice there are some common features:
-
They mostly follow a common formula of a “we’re investigating” message followed by “we have identified the problem and are working on a fix” followed by a final “resolved: between then and now …” message.
-
They don’t follow the common formula rigidly. This means that although many events are ended by a message telling the exact time boundaries (“between …”) there are plenty of those that do not.
-
They are written by humans for humans. They contain typos (“EU-WEST-2” anyone?), contextual references easy for humans but not for computers, different representations for the same information (“Between 14:40 and 16:32 PST”, “Between 1:51 PM and 2:37 PM PST”, “Between 12/17 10:32PM and 12/18 2:12AM PST”, “Between 2:10 A.M. PST and 2:40 A.M. PST” and so on), …
-
There are no correlation identifiers available. This means that just by looking at two different messages you cannot determine whether they are part of the same event. There are overlapping events so just chaining messages in time sequence is not reliable.
-
They are retroactively edited. The simplest case is the inclusion of “[RESOLVED]” to the subject line for all messages for a resolved incident. There are more complex examples where the message body has been amended multiple times during the course of an incident.
Below is an example of one such message. The message itself was published at March 20th 2013 08:36 PM PDT. I have only two snapshots of the message so I can confirm only the addition of an 03:09 AM update (plus minor formatting changes), yet it is possible to infer that it has been edited multiple times at around 8:45 PM, 9:43 PM, 11:49 PM, 12:36 AM (next day), 02:33 AM, 03:09 AM and 04:03 AM.
Informational message: [RESOLVED] Back-end instance registration issue
Increased provisioning times 8:45 PM PDT.PDT We are investigating increased provisioning, scaling and back-end instance registration times for load balancers within the US-EAST-1 Region. 9:43 PM PDT.PDT We continue to investigate increased provisioning, scaling and back-end instance registration times for load balancers within the US-EAST-1 Region. We can confirm that request traffic to existing load balancers has not been impacted by this issue. 11:49 PM PDT.PDT We have identified the root cause of the increased provisioning times in the US-EAST-1 Region and are working to return the service to normal operation. We can confirm that request traffic to existing load balancers has not been impacted by this issue. Mar 21, 12:36 AM PDT.PDT Between 7:45 PM PDT on 3/20/14 and 12:14 AM PDT on 3/21/14 we experienced increased provisioning, scaling and back-end instance registration times for load balancers within the US-EAST-1 Region. Request traffic to existing load balancers was not impacted by this event. The issue has been resolved and the service is operating normally. Back-end instance registration issue 02:33 AM PDT.PDT We are investigating a back-end instance registration issue affecting a small number of load balancers within the US-EAST-1 Region. 03:09 AM PDT We have identified the root cause of the back-end instance registration issue affecting a small number of load balancers within the US-EAST-1 Region. We have made progress in resolving the issue for some load balancers and continue to work on remaining load balancers. 04:03 AM PDT We have corrected the back-end instance registration issue for the majority of the affected load balancers within the US-EAST-1 Region, and continue to work on the remaining load balancers.
-
Some messages have HTML formatting, but most are pure plain text. It seems that longer-running events with multiple updates are more likely to contain HTML formatting (primarily colors). The previous message originally contained HTML formatting, but I’ve stripped it out (it does not seem to contain any semantic meaning).
-
Severity of an event is almost never discussed in detail. What you get is “a subset of instances were affected”, “a small portion of”, “some” or similar. Sometimes as an added assurance the number of availability zones affected is included (which almost without fail is always “one”).
-
It seems that it is possible to differentiate between at least some people by their writing style, although this seems to apply more to older messages than more recent ones (internal standardization?).
Any of these are not big problems for humans. Most of the typos and mistakes are such that a human can easily infer the correct meaning from context. Humans are super-cool contextual inference engines, superb at piecing messages together into a cohesive understanding. What’s difficult (guess what I’ve been up to?) is trying to turn these automatically into quantitative information about outage events.
Now this isn’t a poke at AWS’s dashboard. Building trust by sharing outage information publicly is very important, all kudos to AWS for that. AWS has done also a great job in posting analyses of larger incidents (example). These are just things I’ve found out while doing in-depth analysis of AWS outages and digging deep into dashboard messages. I have not found any deficiencies or systematic errors that would devalue AWS service health dashboard as a very good source of current up-to-date incident and outage information.
(If your ops team is currently not monitoring AWS dashboard RSS feeds for the services and regions you are operating, well, do so.)
blog comments powered by Disqus